

Introduction
Every enterprise today runs on data pipelines that stretch across source systems, ingestion layers, transformation jobs, warehouses, and the dashboards executives check every morning. When that chain works, data-driven decisions feel effortless. When it breaks silently — a schema change here, a missed batch there — the damage is often invisible until a business leader questions a number in a board meeting. This is the problem data observability is designed to solve, and it's becoming a must-have for any enterprise that relies on data to run its business.
In this post, we break down what data observability is, why it's essential for enterprise data reliability, and how a structured observability practice and automated data reconciliation and quality checks can help organizations identify issues in minutes rather than weeks.
What Do We Mean by "Enterprise Data Reliability"?
Enterprise data reliability is the assurance that the data moving through your systems is complete, accurate, timely, and consistent enough to be trusted for decision making, every time — not just when someone checks it. It is not a one-off quality check; it is a guarantee of quality that is part of the ongoing operation.
With the growing number of cloud data warehouses, streaming pipelines, and AI models, the number of places where data can silently break has multiplied. When a schema change occurs upstream, it can ripple through dozens of tables, reports, and models before anyone realizes it. Without observability, reliability is just a matter of luck, not design.
The Rising Cost of Data Downtime
"Data downtime" — periods where data is missing, inaccurate, or simply wrong — behaves a lot like application downtime, except it is far less visible and far more expensive to diagnose. A broken pipeline doesn't throw an error page; it quietly feeds bad numbers into dashboards, forecasts, and customer-facing systems.
The business impact tends to show up in familiar ways:
- Executives lose confidence in dashboards and start reconciling numbers manually.
- Finance, sales, and operations teams make decisions on stale or incomplete data.
- Engineering teams spend hours firefighting instead of building new capabilities.
- Compliance and audit teams struggle to verify data accuracy and demonstrate how data has been processed across systems.
- Customer-facing systems (billing, recommendations, risk scoring) act on wrong inputs.
The longer an issue goes undetected, the more systems it touches — and the more expensive and painful it becomes to trace back to its root cause.
Why Traditional Data Quality Checks Fall Short
There are already a lot of data quality checks being performed in most enterprises, such as null checks, format validation, and referential integrity rules. These are required but are usually performed at a specific stage of the pipeline, at a fixed time, and to detect a set of issues that are known and predetermined.
Data observability goes beyond that. It keeps an eye on the behavior of your data and pipelines — freshness, volume, schema, and distribution — and can alert you to anomalies you didn't expect, in near real time, and tell you exactly where they came from in the pipeline.
How Observability Checkpoints Work Across the Pipeline
Reliability is not a single checkpoint — it has to be built into every hop of the data journey. A robust observability layer places checks at each stage of the pipeline, so an issue is caught close to where it originates rather than three systems downstream.
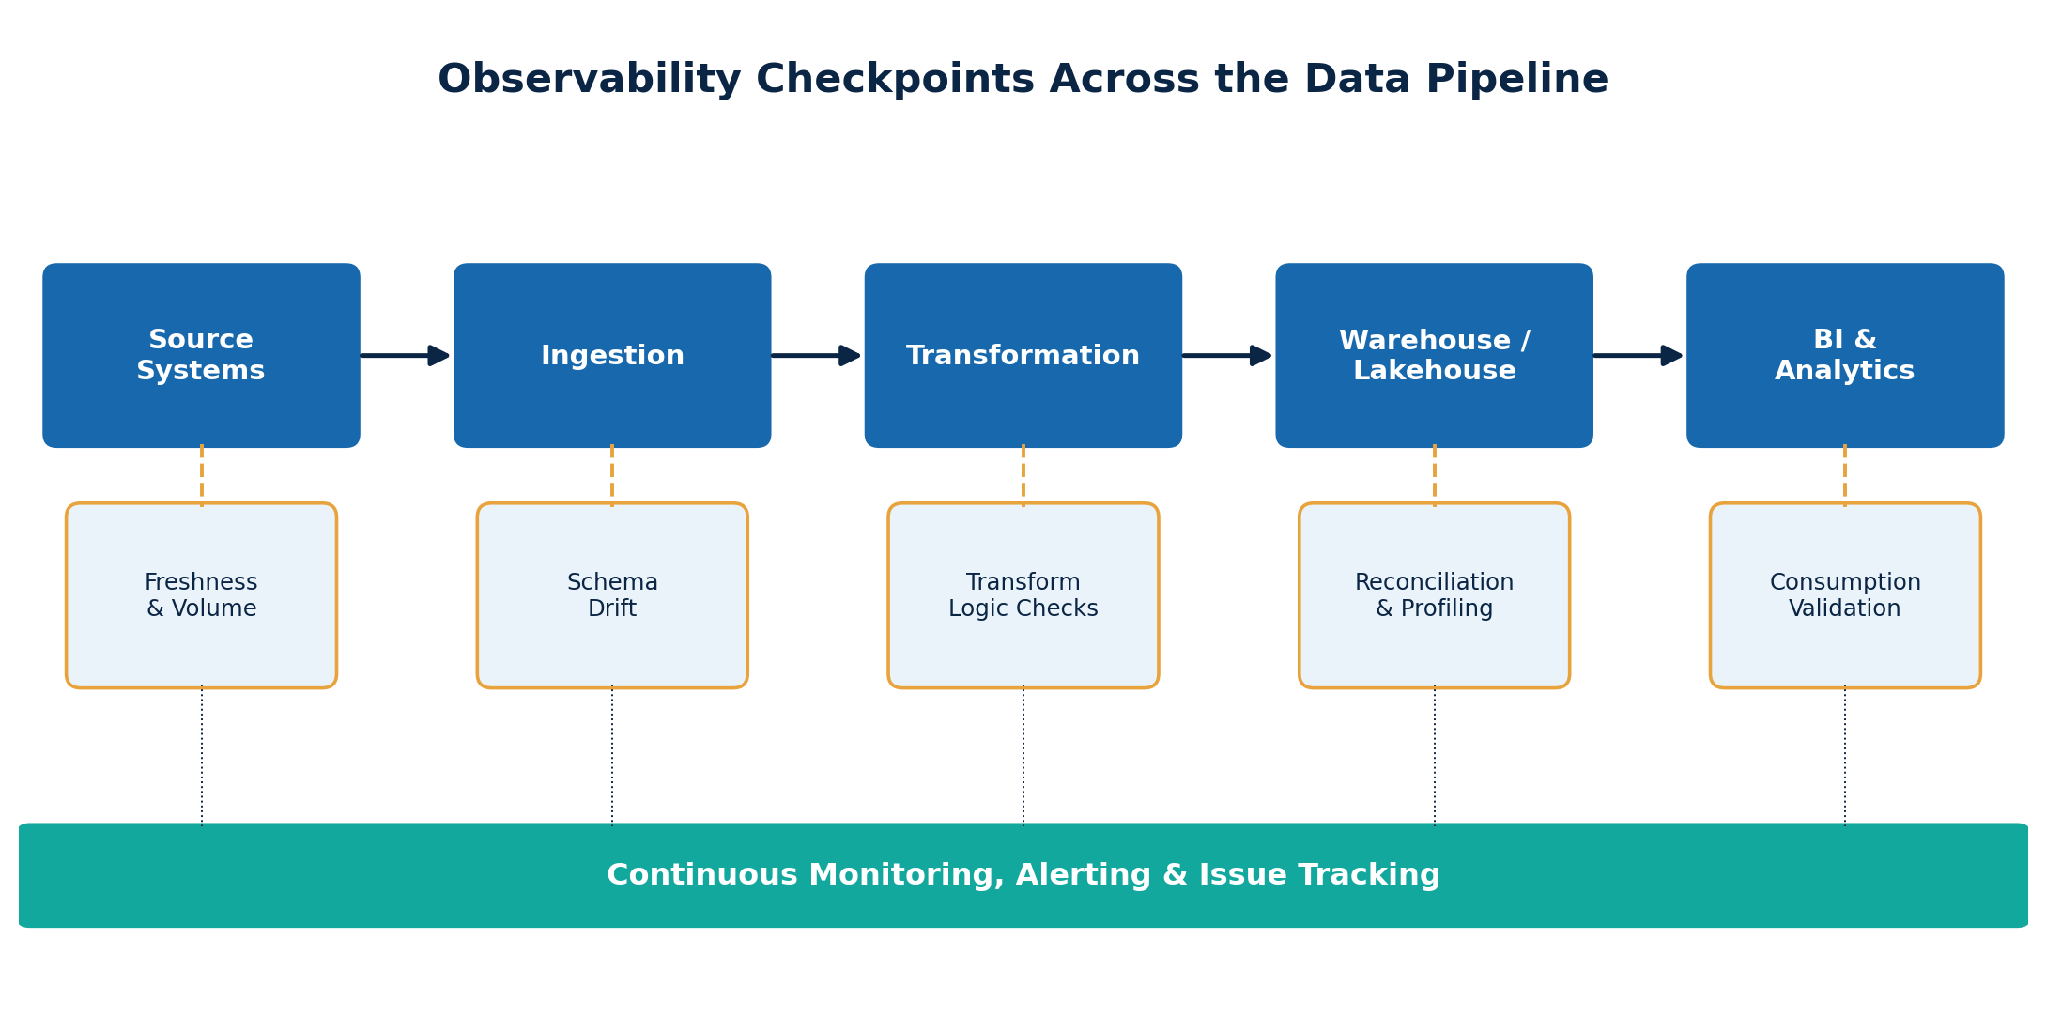
Figure 1: Observability Checkpoints Across the Data Pipeline — from source systems to BI & analytics.
This layered approach means a schema change at ingestion is flagged before it reaches transformation logic, and a reconciliation mismatch at the warehouse layer is caught before it ever reaches a dashboard a business leader relies on.
How 4DAlert Detects Data Issues in Minutes, Not Weeks
The true impact of data observability is not a philosophical one — it's measured in time. Data problems are usually only identified when a report seems incorrect or when a user complains, many days or weeks after the problem started. With 4DAlert's continuous monitoring and real-time alerting, the same issue is automatically detected within minutes, enabling teams to investigate and resolve problems before they impact downstream systems.
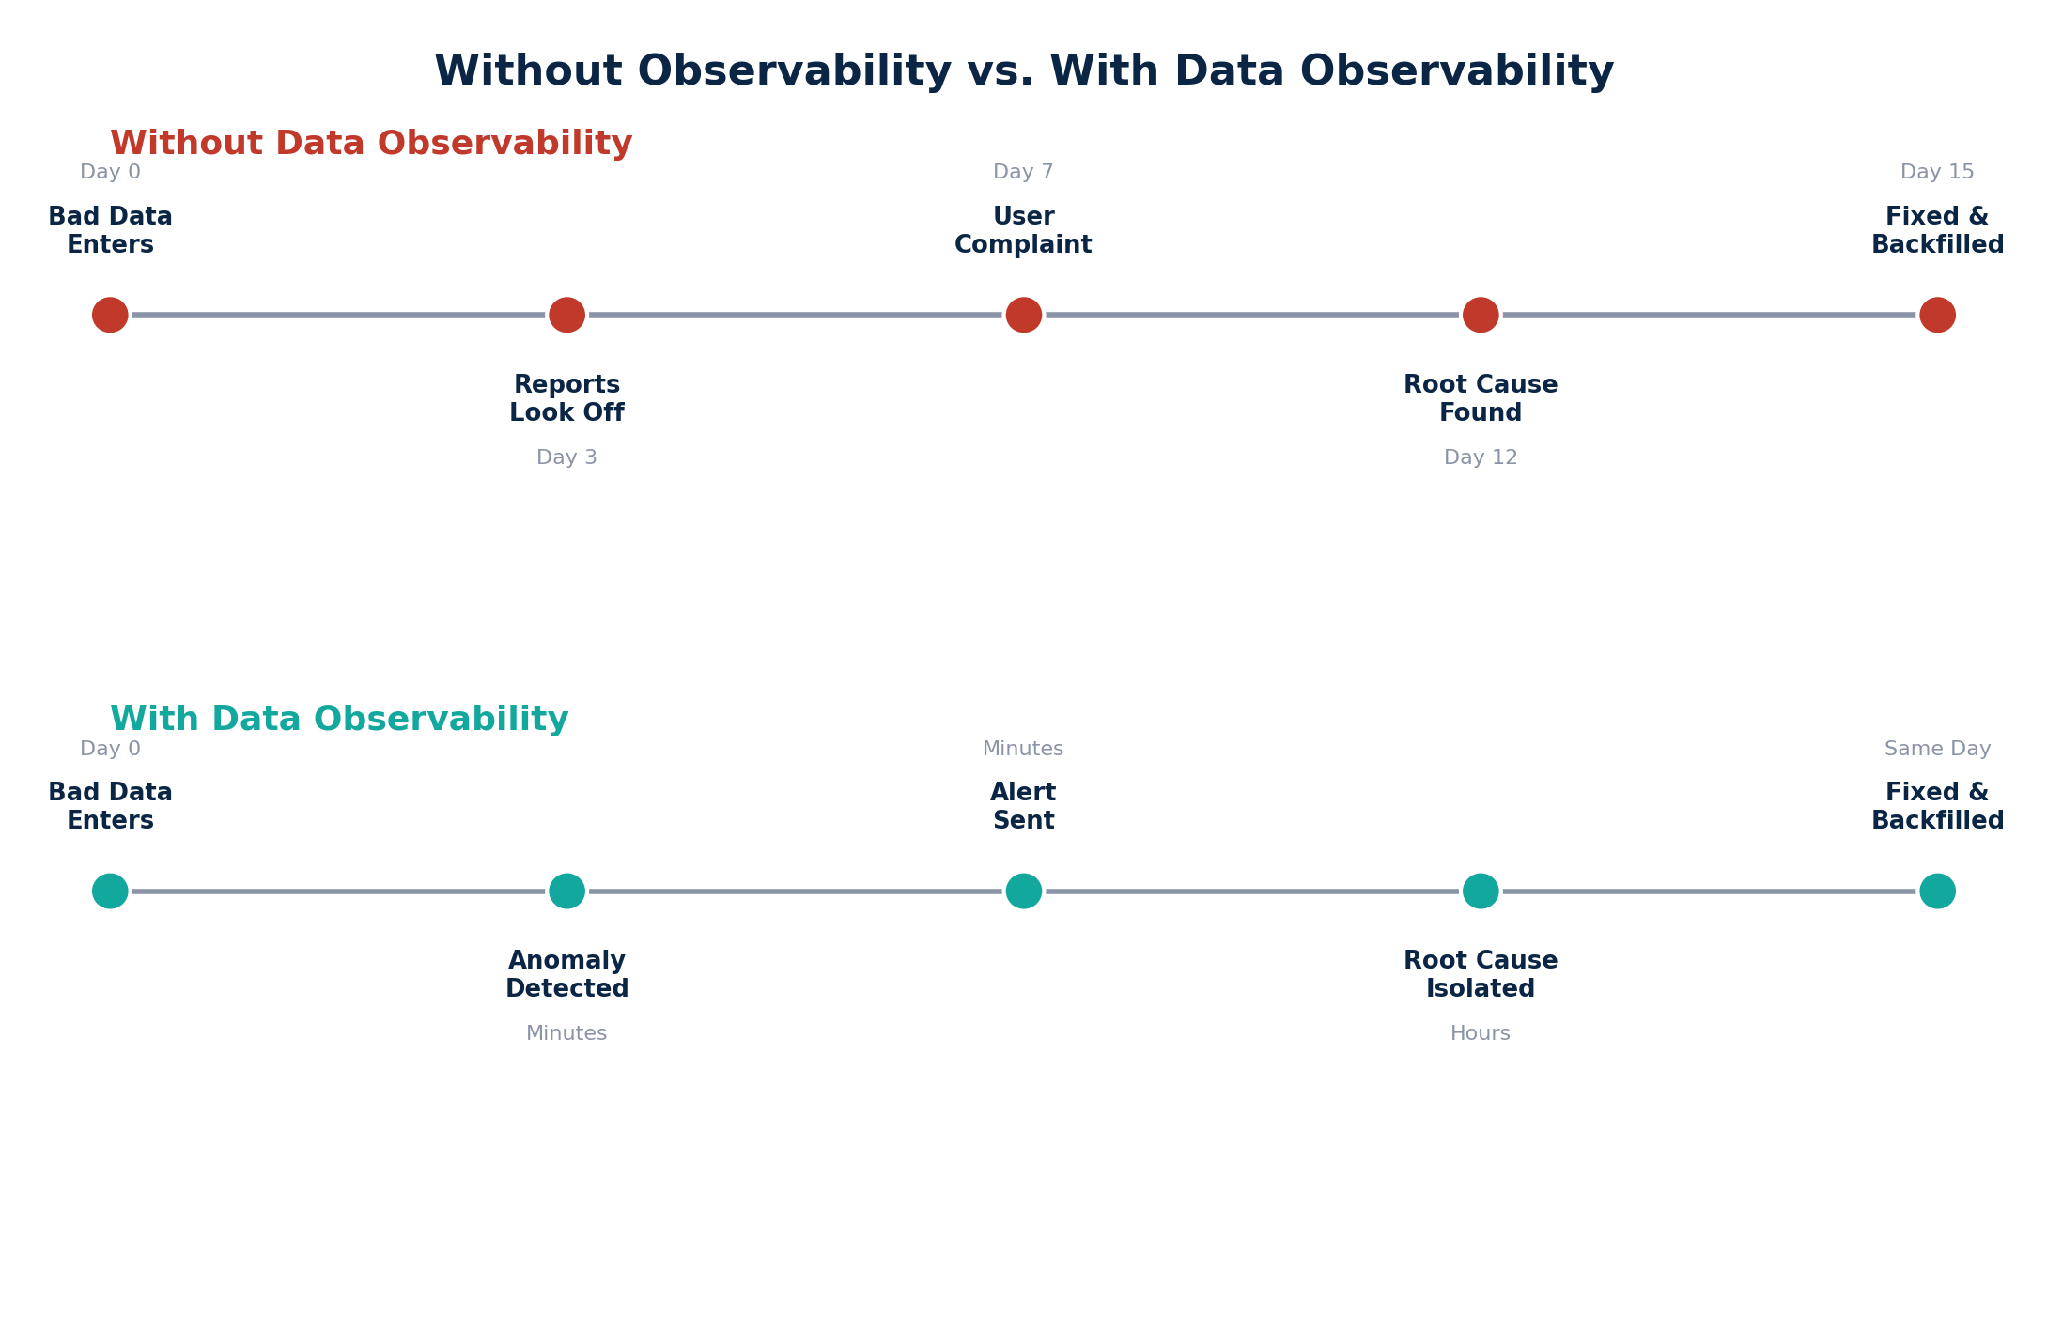
Figure 2: Incident Timeline Comparison — With vs. Without Data Observability.
Not only does a smaller detection window narrow the firefighting window, but it also directly impacts the extent of the spread of bad data before it is contained, which can be the largest component of the total cost of a data incident.
Data Observability Quality Score Dashboard: The 4DAlert Data Observability Quality Score Dashboard offers real-time visibility into data quality and calculates an overall Data Quality Index (DQI), alerting teams when data quality issues arise and allowing them to identify and resolve problems within minutes rather than days.
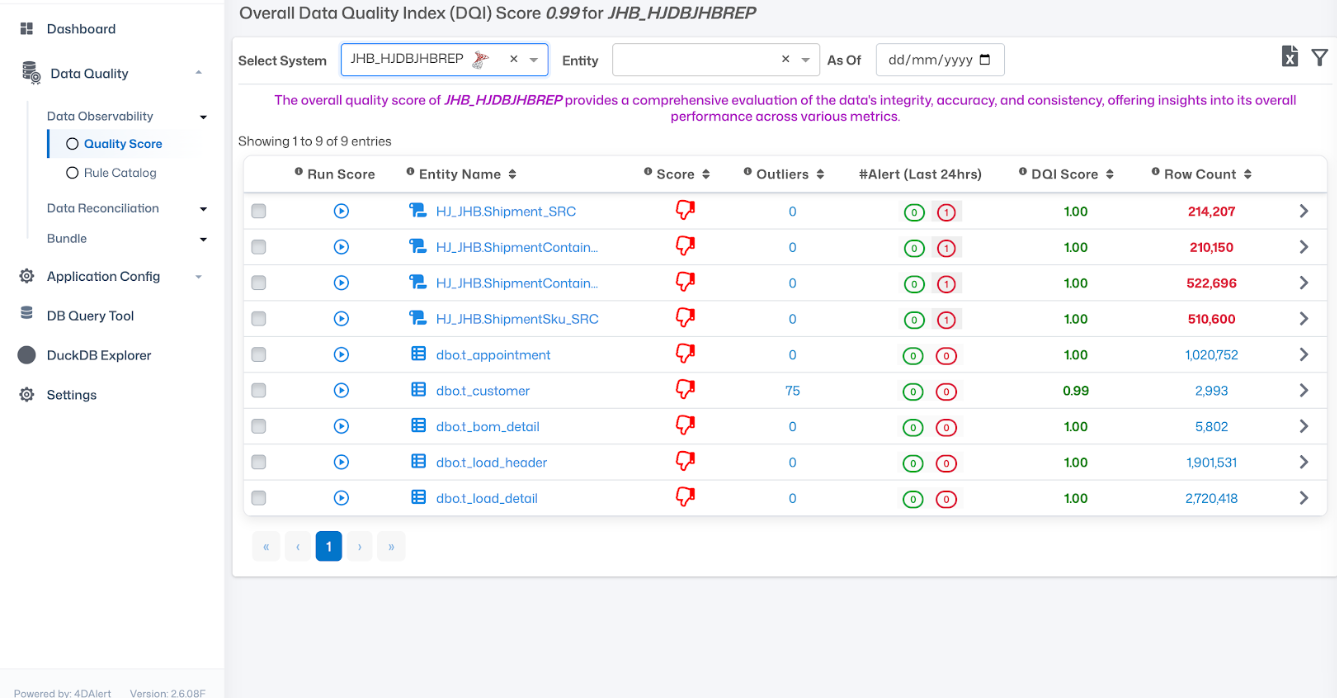
Figure 3: 4DAlert Data Observability Quality Score Dashboard.
Data Observability and Data Reconciliation: Why Both Matter
Observability provides you with the indication that something has changed. Reconciliation informs you if the numbers on both sides of a pipeline are the same. The best results are achieved when the two are used together: observability continually monitors pipeline behavior, and automated reconciliation ensures that source and target — or current data and historical trends — match at a cell level.
4DAlert Data Quality Trend Dashboard: The 4DAlert Data Quality Trend Dashboard shows historical Data Quality Scores and other important data quality metrics like row count, freshness, null count, distinct count, object size, and checksum. It enables teams to check for trends and anomalies, and to track data quality over time by comparing results from multiple runs.
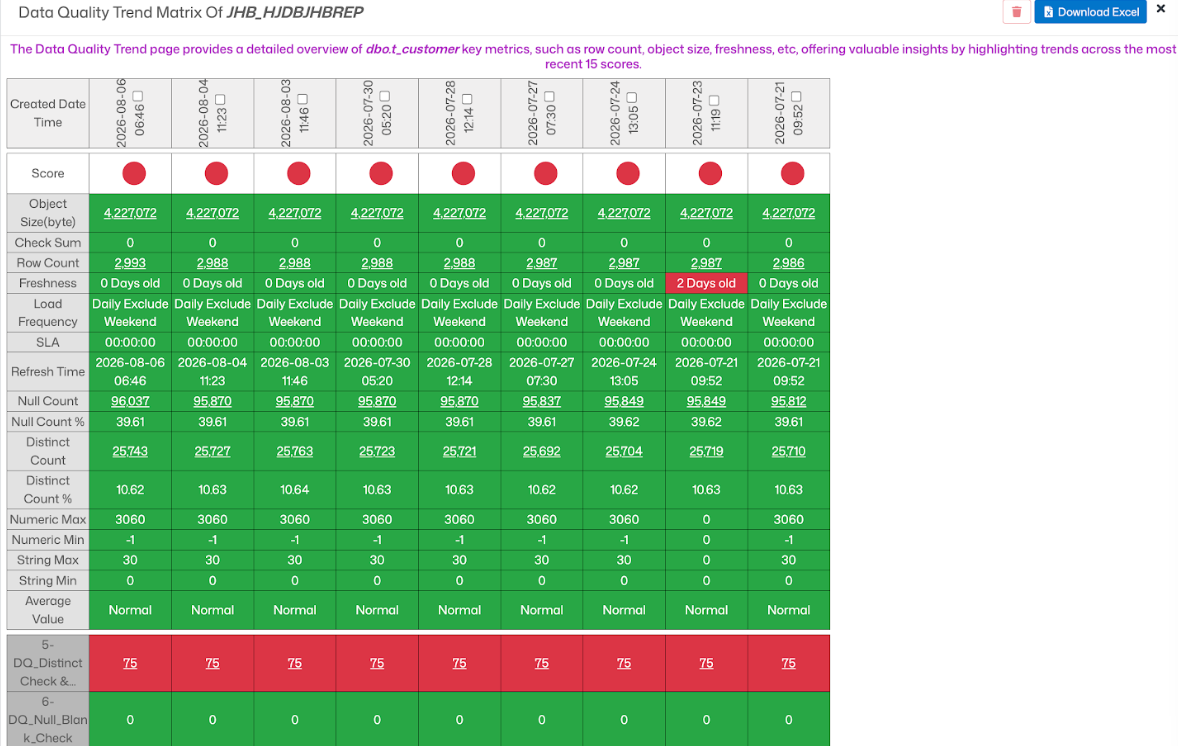
Figure 4: 4DAlert Data Quality Trend Dashboard.
If teams are aware of issues only after they have been scheduled for reconciliation, it is still too late. Teams can sense that something is out of the ordinary, but they don't have the detail-level evidence to prove it and correct it. When combined, observability and reconciliation fill that gap.
Automated Data Reconciliation Dashboard: The 4DAlert Automated Data Reconciliation Dashboard continuously validates data from source to target to ensure that the data is accurately matched. It points out reconciliation issues, detects missing or mismatched records, and helps teams quickly investigate and correct data inconsistencies before they affect downstream systems.
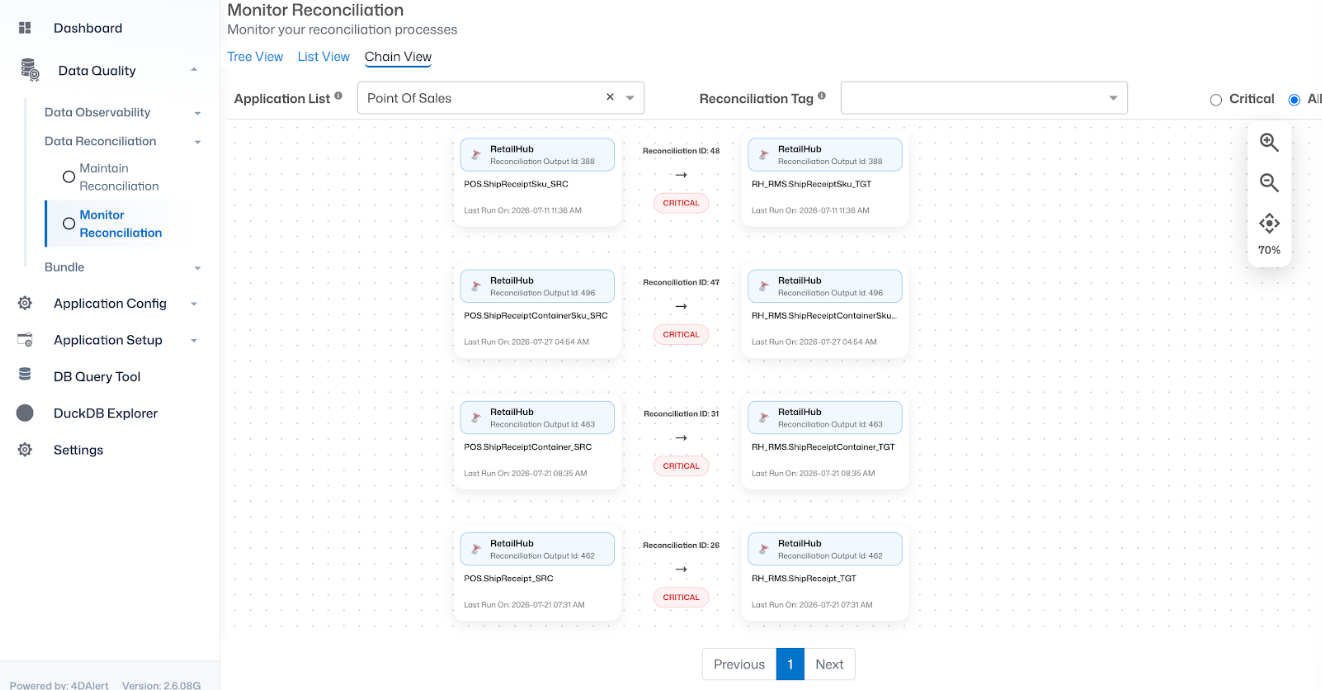
Figure 5: 4DAlert Automated Data Reconciliation — Monitor Reconciliation View.
How 4DAlert Delivers End-to-End Data Observability
4DAlert's Data House platform is designed with an AI engine that is constantly learning how your pipelines operate. It understands how they normally behave and uses that knowledge to apply it to observability, automated data reconciliation, and data quality monitoring — everything in one view, without enterprise teams having to piece it together from multiple point solutions:
- AI-driven monitoring of pipeline freshness, volume, and schema across your integration points, calibrated to each pipeline's own historical behavior rather than static, one-size-fits-all thresholds.
- Real-time, intelligently prioritized alerts the moment the AI detects an abnormality in pipeline execution, so teams see what matters most first.
- Automated, cell-level data reconciliation between sources and targets, or against historical trends, powered by AI matching logic that surfaces mismatches manual spot-checks would miss.
- AI-assisted anomaly detection that continuously learns what "normal" looks like for your data and adapts as your pipelines evolve — no manual rule-writing required.
- Centralized issue tracking and predefined dashboards, enriched with AI-generated context on each issue, that give every stakeholder the same view of data health.
The outcome is an enterprise data platform where reliability isn't a hope — it's a measure, monitored and continuously improved with AI.
Closing Thoughts
Manual checks and after-the-fact firefighting just don't scale as data volumes grow and the number of systems consuming that data continues to increase. A pipeline may be technically sound, but the data it provides can still be incomplete, inconsistent, stale, or different from what the business actually needs.
Data observability brings data health to the forefront, allowing teams to uncover unusual pipeline activity, catch data quality problems early, and gain insight into the root cause of issues. When paired with data quality and automated reconciliation, it offers a more solid basis for data validation, change tracking, and data consistency. AI can augment the workflow beyond alerts — providing context, helping teams determine potential causes, and speeding up investigation and remediation.
That's the transition from reactive data monitoring to proactive data reliability.
See how 4DAlert combines these capabilities when your team is spending too much time investigating missing records, unexpected data changes, reconciliation failures, or pipeline anomalies.
Discover how 4DAlert can help you monitor data health, detect anomalies, validate source-to-target consistency, and build greater trust in the data powering your business.