

Introduction
With the growing reliance on real-time analytics, automated processes, and machine learning projects, ensuring the reliability of data pipelines is a major concern for modern enterprises. Enterprise data architectures handle huge amounts of structured and unstructured data in cloud data warehouses, transactional systems, and operational datastores. In this context, the main engineering challenge is not to ensure a sufficient volume of data, but to ensure that the data is accurate, consistent, and up-to-date.
Data quality and data observability have transitioned from downstream clean-up activities to core data engineering practices. If not properly monitored and validated, undetected delays, missing data, or schema changes can taint business metrics, disrupt workflows, and undermine trust in analytics for decision making. To create robust and scalable data architectures, it is crucial to understand the concept of data quality, its importance, and how the current engineering landscape — including autonomous AI — is tackling the challenges of data quality.
What Are Data Quality and Data Observability?
They are frequently used synonymously but are complementary aspects of a sound data infrastructure. Data quality is about verifying static objects — ensuring that particular records adhere to structural and business rules like accuracy, completeness, and consistency.
Data observability is about the "health" of the end-to-end system, providing real-time visibility into pipeline behavior over time through data telemetry, including signals such as freshness, volume, and schema evolution.
Think of data quality as checking the fuel for impurities, and data observability as the dashboard that monitors pressure, temperature, and consumption across the whole engine.
Quality checks evaluate static data assets against known rules at a point in time. Observability monitors the dynamic behavior of data in motion, continuously, across the whole pipeline lifecycle.
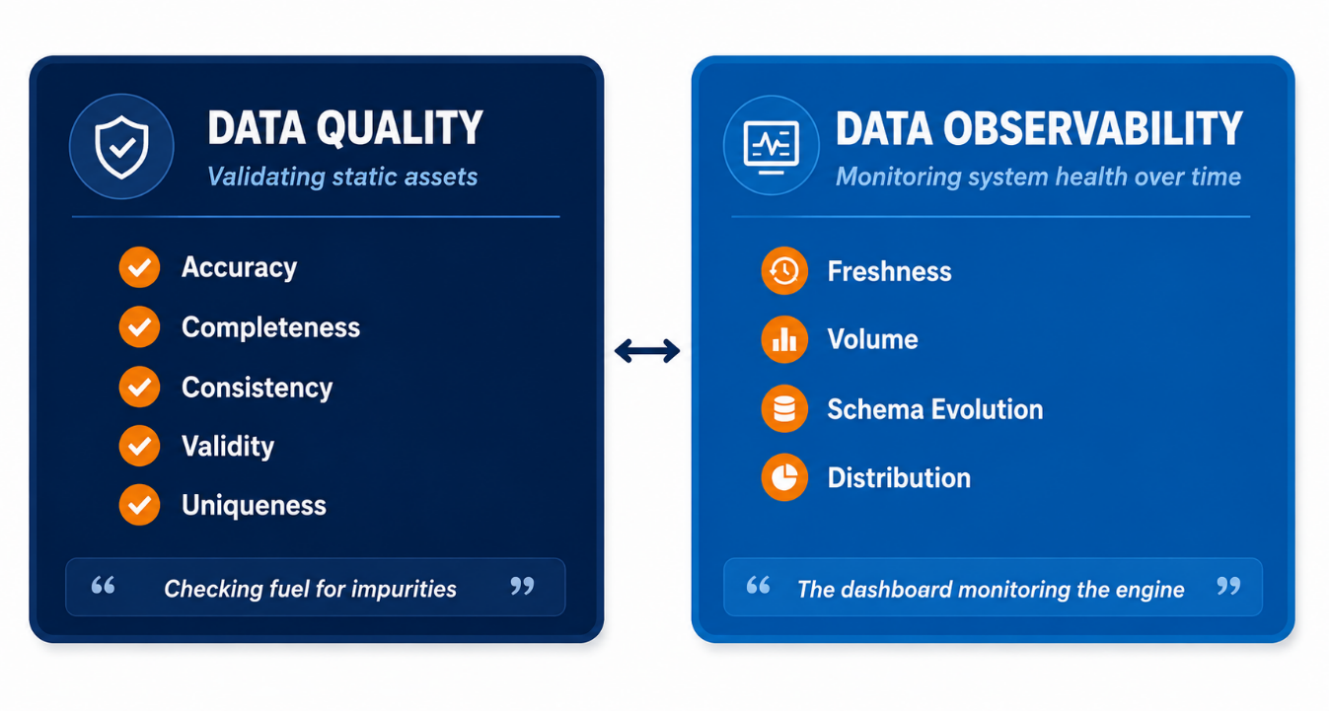
Figure 1. Data quality validates the asset; data observability monitors the system.
Why They Matter in Modern Data Engineering
Today's pipelines are distributed, dynamic, and constantly changing. Software bugs are prone to making themselves known: a script crashes, an error code is fired. Data errors are more subtle — a pipeline can run to a 200 OK response and write bad data downstream, and no one will notice until it has propagated.
When data health fails, it doesn't stay contained. It's quick and it's pervasive:
- Analytics & BI dashboards — corrupted metrics, unhandled nulls, or missing line items distort executive KPIs and mask true financial or operational performance.
- AI and machine learning models — models trained on degraded or drifted data run into a simple problem: garbage in, garbage out. Forecasts go bad, and automated recommendations follow them.
- Operational workflows — automated inventory reordering, patient record synchronization, and billing operations can all execute faulty actions on corrupted payloads, with real-world costs attached.
- Organizational trust — repeated data incidents wear down the trust between engineering teams and business stakeholders, slowing decisions and pulling engineering time into reactive firefighting.
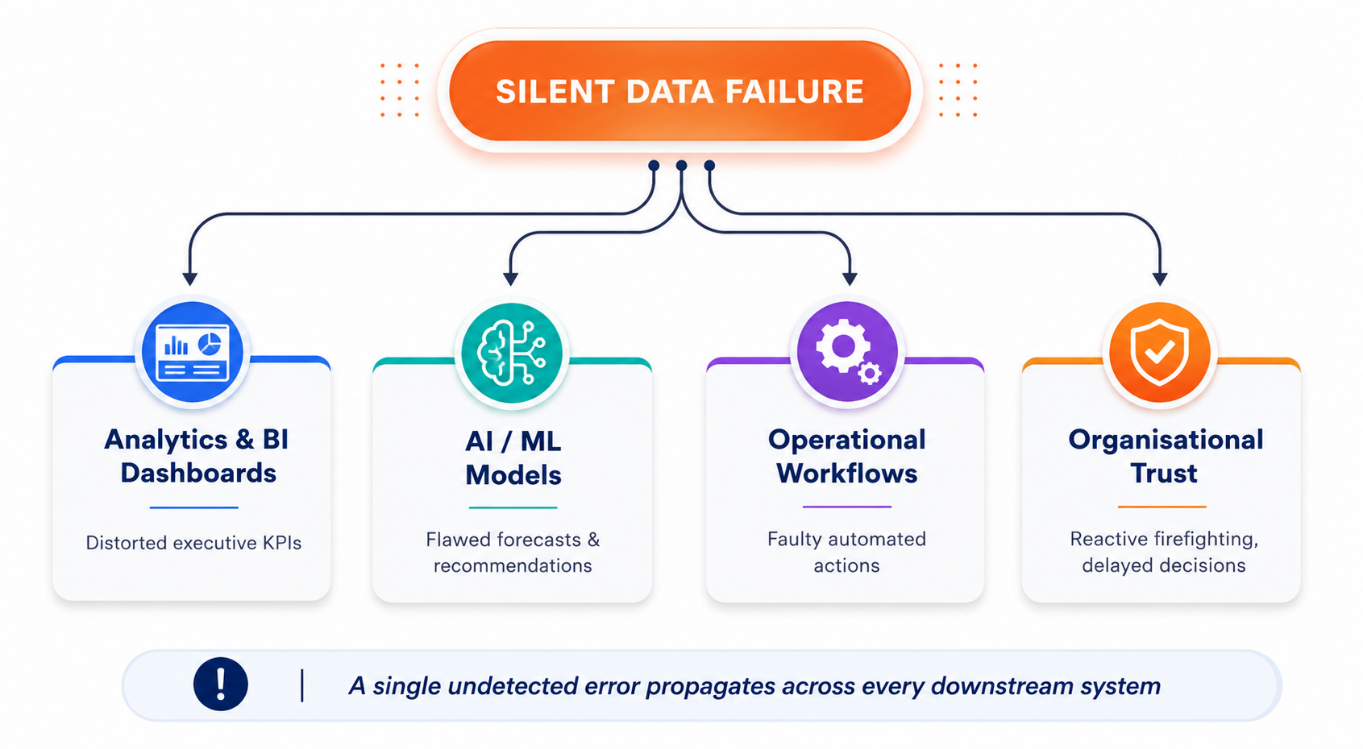
Figure 2. One silent data failure cascades into four distinct business impacts.
Challenges Organizations Face
Keeping data systems reliable gets exponentially harder as the data stack scales.
- Static rule maintenance debt — manually writing and updating validation assertions for thousands of enterprise tables isn't sustainable. As business rules evolve, static thresholds go stale fast, and the maintenance burden never really goes away.
- High false-positive noise — rigid validation rules don't flex for normal business variance — weekend volume dips, holiday sales spikes — which breeds alert fatigue and trains teams to tune out notifications that actually matter.
- Silent data degradation — subtle issues, like a field's missing-value rate drifting from 0.1% to 8% over six months, slip past point-in-time checks entirely and surface only after decisions have already been made on bad data.
Real-World Scenario: The Anatomy of a Silent Pipeline Failure
Consider a realistic scenario inside a growing multi-channel retail business.
The Event. During an overnight update to the e-commerce checkout microservice, an API payload format changed. The unit price field for a specific promotional category began returning null values, while discounts were mistakenly applied as negative sub-totals.
The Failure.
- Without quality checks — the ETL pipeline ingested the payload normally and reported a successful run. Thousands of zero-value order records flowed straight into the central analytical warehouse.
- Without observability — engineering had no visibility that transaction volume for that category had dropped 40% relative to historical Tuesdays, or that pipeline freshness was lagging by two hours due to unhandled retries.
The Impact. The automated stock reordering model had consumed the corrupted pricing and volume data by mid-day. The items with high demand were marked as non-performing, and the orders were automatically cancelled in two key regional distribution centers. Executive dashboards indicated a false sense of a profit margin collapse, and hours of manual SQL debugging were required to determine the root cause of the issue — the checkout update.
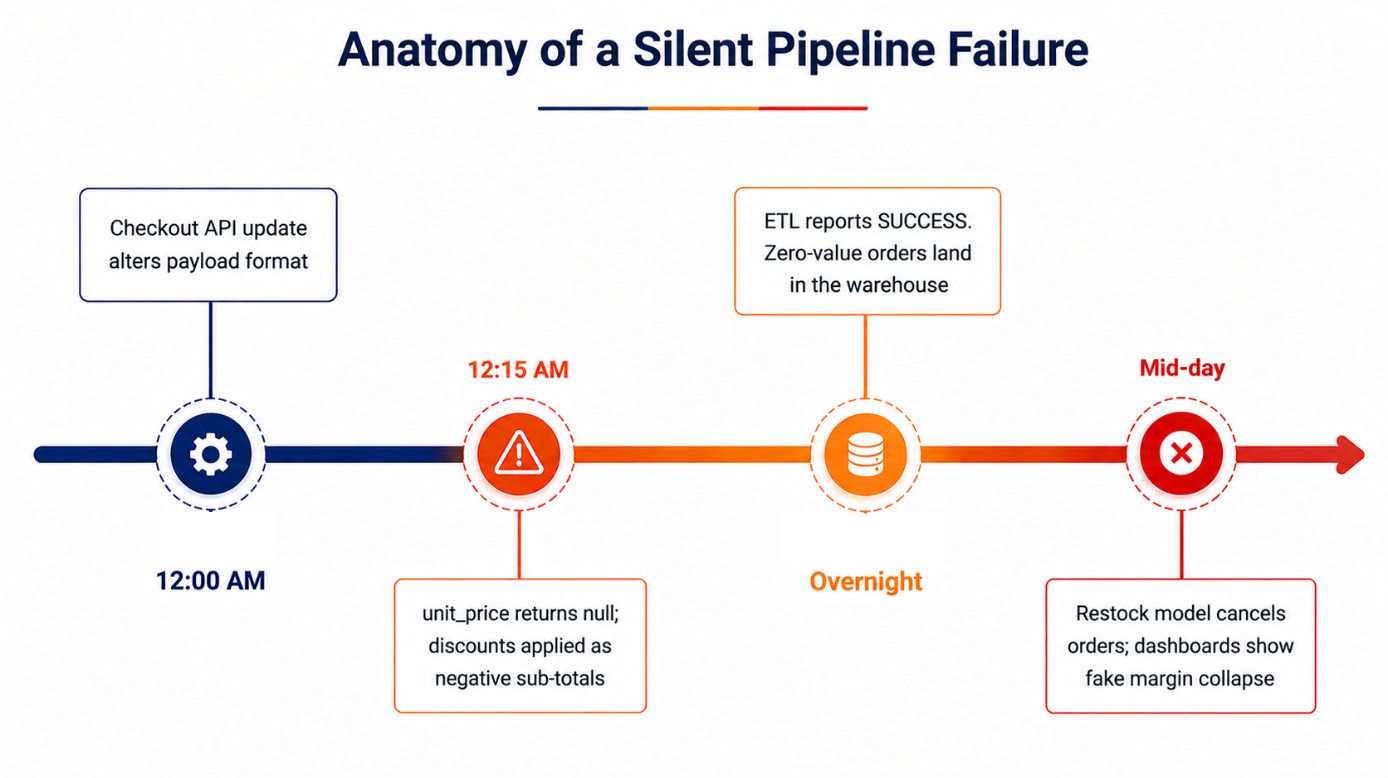
Figure 3. A single schema change at midnight took hours to surface — and by then, the damage had already reached distribution.
How These Challenges Can Be Addressed
Fixing silent data failures means shifting from reactive troubleshooting to an integrated operating model built on four complementary methodologies.
1. Rule-Based Validation
Deterministic validation checks are rules that are hardcoded and cannot be violated in business logic, data contracts, or regulatory requirements. Running assertions — completeness rules, regex-based type formats, relational integrity constraints — will catch or quarantine known-bad data as soon as it arrives.
2. Continuous Monitoring & Historical Trend Analysis
It is not possible to assess data health at a single moment in time. Operational metadata collected continuously can help systems establish statistical baselines for volume, arrival time, value distribution, and other metrics — and historical analysis will uncover the gradual stuff that static rules never catch, such as metric drift or slow schema mutations.
3. Proactive Anomaly Detection
Rather than waiting for a downstream user to spot a corrupted report, automated anomaly engines flag deviations from historical patterns in real time — alerting engineers to pipeline stalls, unexpected data drops, or distribution shifts the moment they happen.
4. The Role of AI and Agentic AI
AI and agentic AI are changing how engineering teams manage data health at scale:
- Adaptive dynamic thresholds — AI models learn normal operational cycles — seasonality, weekly volume shifts — and automatically update validation boundaries, cutting out manual assertion updates and suppressing false alerts.
- Agentic root-cause analysis — autonomous agents inspect graphs, upstream dependency trees, and historical execution logs the moment an alert fires, isolating whether the issue traces back to a source schema change, a network timeout, or a code update — and hand engineers that context immediately.
- Automated corrective recommendations — instead of just firing an alert, agentic workflows generate actionable remediation steps: suggested SQL repair scripts, draft schema update patches, or proposed quarantine actions.
Modern Data Operations with 4DAlert
For engineering teams looking to put these principles into practice, 4DAlert is an enterprise framework built specifically around continuous data quality, automated observability, and intelligent AI assistance. Connecting natively across cloud data repositories and transactional systems, 4DAlert operationalizes data reliability through three core capabilities:
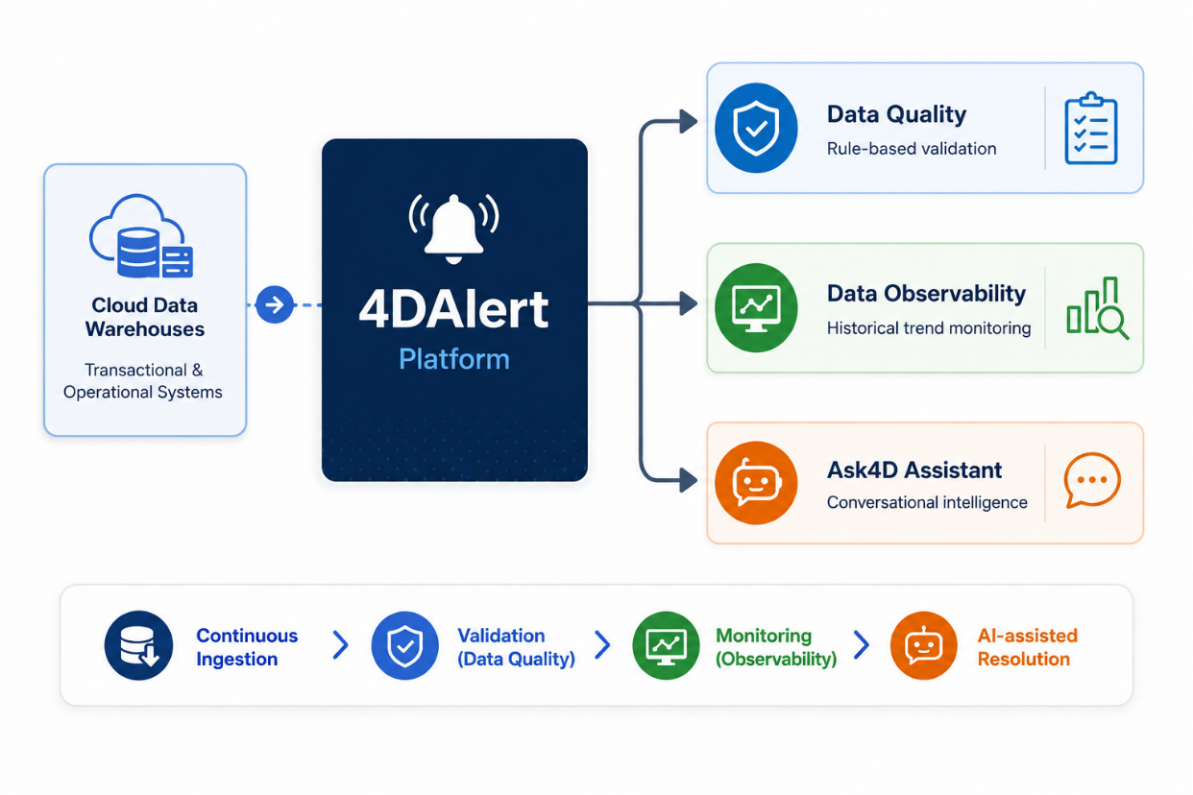
Figure 4. 4DAlert connects to enterprise data sources and operationalises reliability across three capabilities.
4DAlert Data Quality: Rule-Based Validations
4DAlert provides rule-based validation across the typical DQ/DAMA dimensions, allowing teams to define multiple rules per dimension instead of a single rule per dimension:
- Accuracy — values are true to the real world, and are checked against reference data or expected ranges. This traps entries that may be technically correct but factually incorrect, like a price or measurement that is not realistically attainable.
- Validity — ensures that values meet specified formats, types, and business rules. This prevents bad data from progressing downstream — bad dates, out-of-range codes, or fields that don't match a pattern — from doing so.
- Timeliness — ensures that data is received and updated within the expected time frame for the purpose. This alerts loads that are not arriving on time or not arriving at the cadence they are supposed to. This is most important for time-sensitive dashboards and operational decisions.
- Completeness — ensures that the required fields and expected number of records are filled in as expected. This reveals missing values, dropped records, or partial loads before they sneak downstream and affect aggregates and reports.
- Uniqueness — ensures that records that are supposed to be unique do not have unexpected duplicates. This helps prevent double counting in financial reporting, customer records, and any system where duplication directly impacts key metrics.
- Consistency — ensures values remain logically consistent between related fields, tables, or systems. This will detect inconsistencies like the sum of two reports that should be based on the same data.
After rules are set up under a dimension, 4DAlert automatically runs them for each load and aggregates the results into a pass/fail view by dimension and by rule, allowing teams to see at a glance which dimension — and which specific rule — requires attention.
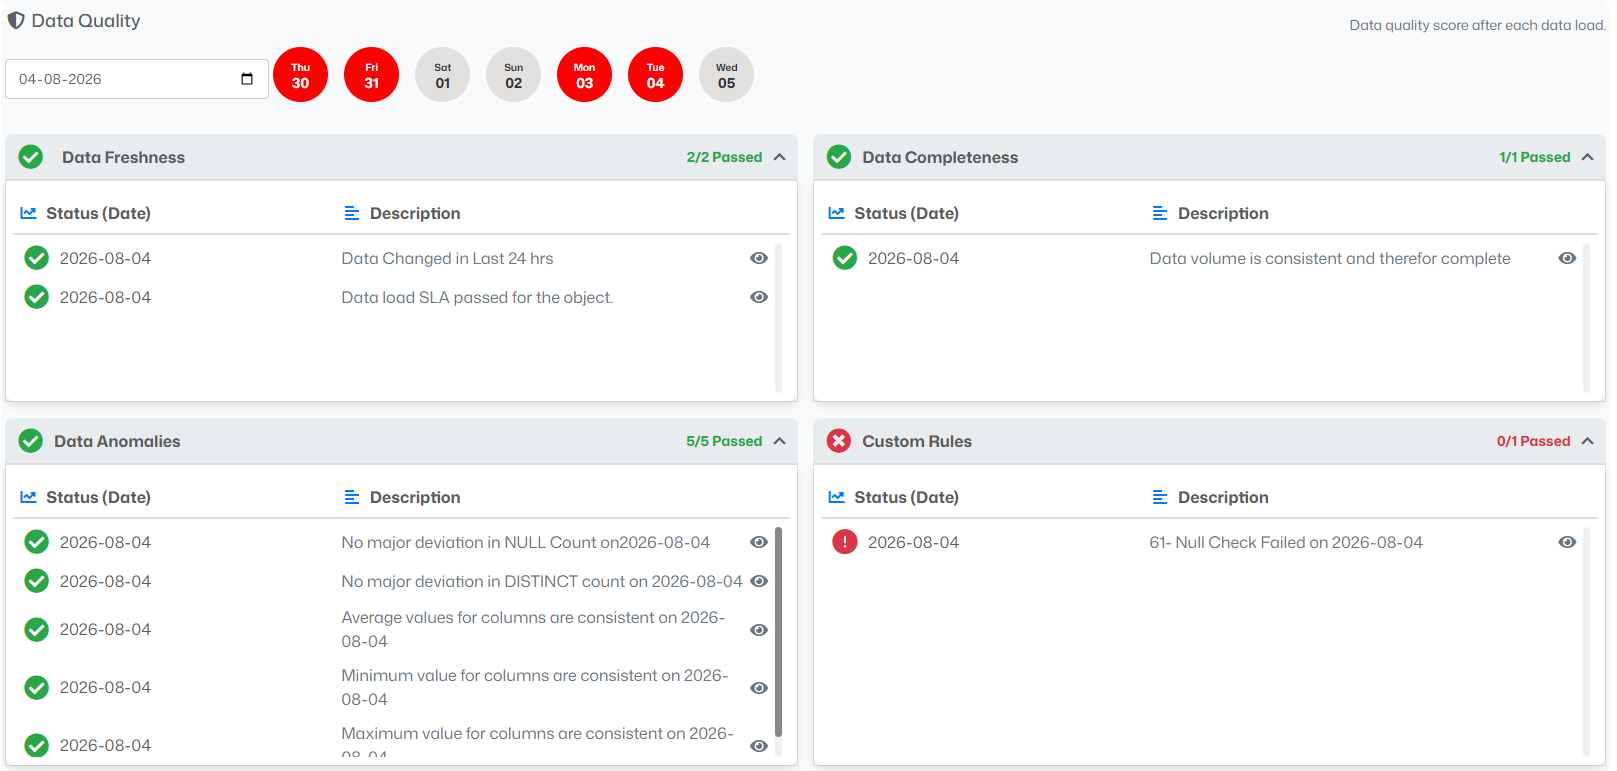
Figure A. Results roll up into a pass/fail view across configured categories.
From Outliers to Resolution: Automated Root-Cause Analysis & Remediation
Setting up and operating rules is just half the job. After a rule set is run against a table or object, 4DAlert continues to the "Fix" phase, not just the "Flagged" phase:
- Rule execution & outlier surfacing — 4DAlert runs each rule in a configured rule set against a target object, and returns the records that fail the rules as outliers, providing teams with the exact rows that need to be reviewed rather than a single pass/fail signal.
- Automated root-cause analysis — 4DAlert traces back through the data and pipeline logic for every outlier returned, eliminating the hours typically required to manually trace a bad value back to its source.
- Auto-generated fix queries — 4DAlert doesn't leave it up to the engineer to write the corrective query to fix each problem it finds; instead it generates the correct query to fix the issue, converting a root cause finding into an executable fix.
- Role-permissioned execution — generated fix queries can be executed directly against the user's connected system, but only within the access boundaries defined by that user's role, ensuring that remediation remains under the same permission model already enforced across the organization.
Taken together, this closes the loop from detection to correction inside a single workflow — a team goes from a configured rule, to a flagged outlier, to a diagnosed cause, to an executed fix, without switching tools or waiting on a separate engineering task.
4DAlert Data Observability: Historical Trend Monitoring
4DAlert continuously tracks historical trends across loads to catch drift that point-in-time checks miss:
- Trend matrix — compares recent load runs side by side for a given object, allowing engineers to see the evolution of each tracked metric over the past few loads instead of looking at just one snapshot in time.
- Volume & integrity metrics — monitors row count, object size, and calculated checksum over time to detect content changes silently. This exposes instances in which a load appears successful, and the row count is normal, but the contents of the load have still changed in significant ways.
- Distribution metrics — track null percentage, distinct count, and value ranges for slow deviations by load. These changes are gradual and are just the type of degradation that a single point-in-time rule cannot detect alone.
- Automated flagging — identifies any metric that deviates from the historical pattern, and flags it against the recent historical pattern of the object, not a fixed, one-size-fits-all threshold that fails to consider normal variance.
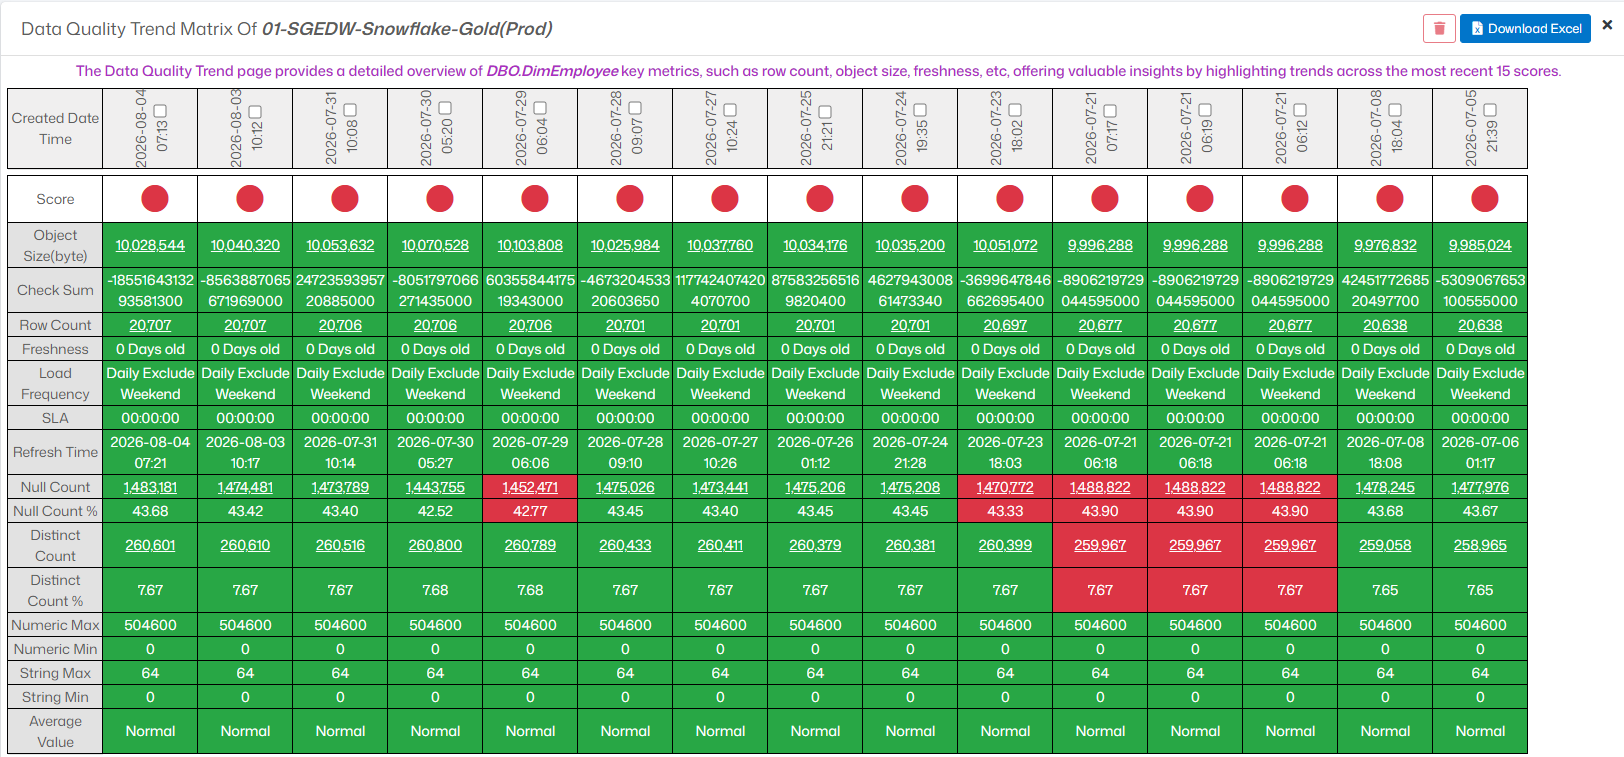
Figure B. The 4DAlert Data Quality Trend Matrix.
Data Quality Index (DQI)
4DAlert rolls both layers into a single score per system, with entity-level drill-down:
- Unified scoring — provides one score per connected system, and then entity by entity, so that teams can monitor the overall data health score, but can also see exactly which table is causing the score to drop.
- Outlier & alert tracking — surfaces detected outliers and alerts raised in the last 24 hours for each table, so recent issues are immediately visible without having to open each object's individual history to check for problems.
- Filtering & export — lets teams filter results by system or entity and export the full breakdown for stakeholder review. This allows for easy sharing of a snapshot of data health with business teams or leadership without manual report building.
- On-demand runs — runs a new check on any table directly from the dashboard, without waiting for the next scheduled run. This is useful when investigating a live issue or validating a fix immediately after it's deployed.
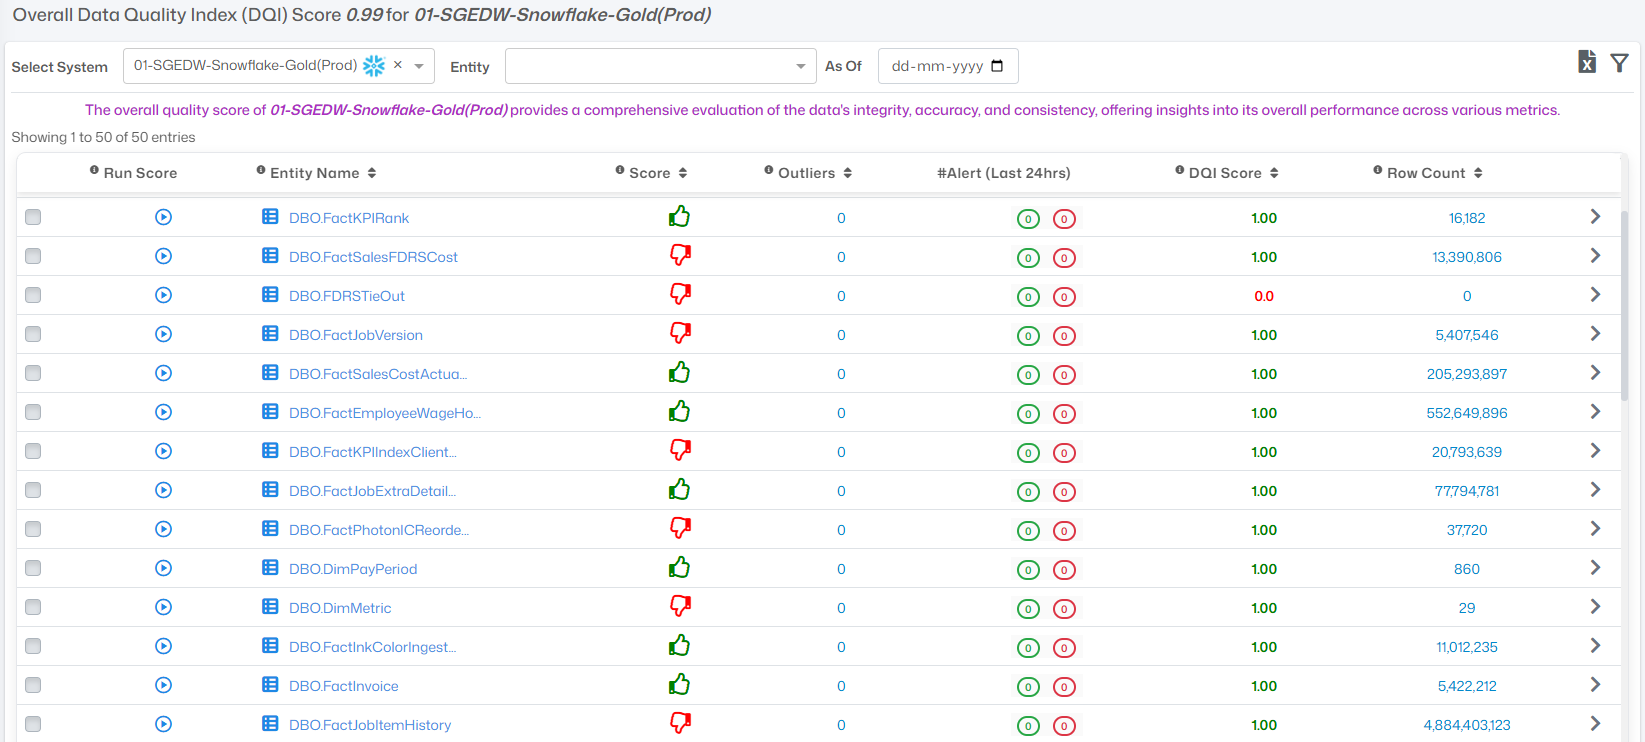
Figure C. The 4DAlert Data Quality Index dashboard.
Ask4D AI Assistant: Conversational Intelligence
4DAlert integrates the Ask4D GenAI assistant to simplify incident investigation and cut operational friction:
- Conversational queries — allows users to ask questions about the status of data quality and recent data quality execution metrics in natural language, rather than navigating through multiple dashboard screens or writing manual queries to get the same information. For instance, users can ask, "Which tables have data quality problems within the past 24 hours?"
- Anomaly investigation — lets engineers, data stewards, and analysts investigate pipeline anomalies and historical trends in a conversational way, without having to write SQL or know the underlying schema. For instance, they can ask, "Why has the data quality score for the customer table dropped?"
- AI-assisted troubleshooting — offers context-aware suggestions for quicker root cause determination, reducing the time spent by teams manually correlating logs, schema changes, and upstream dependencies during an incident. For instance, users can ask, "Why has there been a sudden drop in order volume, and which pipeline was impacted?"
Conclusion
Data quality and data observability are no longer optional features in the data stack, but essential for reliable modern data engineering. Deterministic rule-based checks ensure that data flowing into the system adheres to critical business rules, and continuous observability offers system-wide visibility to detect subtle drift, schema changes, and pipeline stalls over time.
Combined with AI, agentic AI, and natural-language assistants such as Ask4D, these disciplines can help organizations prevent data failures before they happen and reduce manual engineering overhead. An investment in integrated data health translates to downstream BI dashboards, operational engines, and machine learning programs all operating on data that people can trust.